
My Deno Deploy cold-start was 4 seconds
I have a time tracker on Deno Deploy. Over the last few months I’d been pushing into it constantly — Plotly charts on the stats page, Google OIDC replacing the old email/password flow, passkeys via WebAuthn, a Tripletex sync for end-of-month timesheets. A lot of features, a lot of dependencies pulled in, a lot of CI fights getting svelte-check and Playwright happy alongside Deno’s runtime quirks.
Around a month ago I started noticing the app felt sluggish. Not all the time — load the start page, do a navigation, and the second one would sometimes pause for seconds before doing anything. Could be ten seconds since the last hit, could be a couple of minutes. I never pinned down the eviction window — that’s part of this story.
My first instinct was bloat. A fresh SvelteKit app uploads at about 35 MB through the Deno Deploy pipeline. Mine was at 133 MB. So I went hunting for fat — what’s pulled in, what’s tree-shakeable, what’s only needed in dev. That turned out to be a dead end. Plotly is genuinely big, mermaid is genuinely big, and neither was the actual problem.
My second instinct was Node muscle memory: “if the first request is slow, warm things up at boot.” I added a warmPool() that opened four Postgres connections in parallel during SvelteKit’s init(), plus eager housekeeping for session cleanup and a bootstrap admin upsert. The pattern felt right from years of caching and start-up tuning on long-lived servers. On Deno Deploy it made things worse, not better, which I didn’t immediately understand.
The thing that was making it really hard to debug: I have full OpenTelemetry on this app — metrics, traces, the whole observability story Deno Deploy ships for free. None of it catches the cold-start. OTEL begins inside your request handler. The boot phase that precedes the first Deno.serve callback is invisible to it. The only signals I had were curl -w '%{time_total}\n' from outside and the server-timing header I add inside the handler — and the gap between those two numbers is the cold-start. There may be a more elegant way to instrument it; I haven’t found one.
So I ran the curl. After a few minutes of idle, the slowest sample looked like this:
$ curl -o /dev/null -s -w '%{time_total}\n' https://time-tracker.tolu.deno.net/
4.012
Four seconds. Warm requests came back in ~110ms. The app wasn’t broken — the boot was.
I opened the Deno Deploy log stream and triggered another cold-start:
isolate boot — region eu-central
Initialize [email protected]
Initialize [email protected]
Initialize @sveltejs/[email protected]
Initialize [email protected]
Initialize [email protected]
Initialize [email protected]
Initialize [email protected]
… (~55 more)
About sixty Initialize <pkg>@<ver> lines, totalling roughly three seconds — most of them packages I never run at runtime. vite, rolldown, lightningcss. Build-time tooling. Why is the runtime loading them on every cold-start?
That question is what cracked it open. The short version: I had the mental model of a Node server. Long-running process, init once, amortise over thousands of requests. That model is wrong for an isolate, and it leaks into config choices and “performance fixes” in ways that aren’t obvious until you go looking.
What an isolate actually is
A Deno Deploy isolate is V8’s primitive — one heap, one garbage collector, one compilation pipeline. The whole point of the isolate model is that it boots fast. From The Anatomy of an Isolate Cloud:
V8 isolates were designed to be used in the context of the web browser… designed to start very quickly and use relatively little memory.
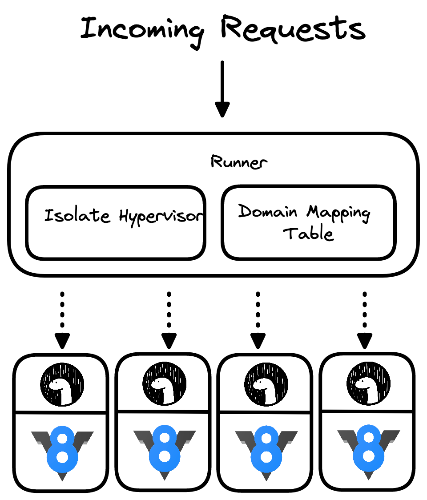
figure: a single runner process hosting many isolates, one per deployment. Source: Deno, The Anatomy of an Isolate Cloud.
A runner is the host process. It contains many isolates, one per deployment, and decides — per request — whether to dispatch into a warm isolate that already exists or boot a fresh one. From outside I just see a fast response or a slow one.
“Start very quickly” hides the load-bearing detail though: the boot cost is whatever your top-level code does. The platform contributes microseconds. Your imports and your module-level expressions contribute the rest. In a Node server, top-level cost is paid once and amortised. In an isolate, the lifetime is effectively zero between bursts — boot, serve a request, get evicted, boot again. Nothing to amortise over.
The two patterns that wrecked my cold-start aren’t bugs. They’re correct code, executed in the wrong runtime.
The nodeModulesDir rabbit hole
Deno offers three modes for how it manages npm dependencies. From the docs:
"none"— no localnode_modules/; deps resolved from Deno’s global cache."manual"— expects you to have rundeno install; Deno reads the localnode_modules/."auto"— Deno automatically installs and revalidatesnode_modules/on every startup.
My deno.json had this:
// file: deno.json (before)
{
  "nodeModulesDir": "auto",
  …
}
I went looking in git history for why — and it turns out I added it five months earlier, in a commit titled “Refactor code structure for improved readability and maintainability.” Twenty files changed: some Svelte component cleanup, some DB tweaks, a favicon swap, and one line in deno.json. Probably solved a svelte-check complaint that day. The commit message never mentions it.
This is the part I want to underline: nobody adds "nodeModulesDir": "auto" thinking I want a 3s cold-start. It happens incidentally, inside a “tidy things up” commit, and then it sits there for five months while the app gets more dependencies and the cost compounds.
What "auto" actually does: Deno walks the full transitive npm graph on every isolate boot, printing one Initialize line per package. Sixty packages × ~50ms each = the three seconds I was looking at. On a Node server I’d never notice — it runs once at startup. On Deno Deploy it runs every time a user clicks something cold.
The fix took one line:
// file: deno.json
- "nodeModulesDir": "auto",
Just remove it. With package.json present, Deno defaults to "manual". The explicit override I’d added was documenting the default… of a value I’d then changed to something worse. Unsetting it dropped cold-start TTFB from ~4000ms to ~692ms.
This is the moment that reframed the whole exercise for me. The framework was right; my override was wrong. I hadn’t fixed anything by setting "manual" — I’d fixed something by unsetting "auto". The instinct that says “be explicit” needs an asterisk in serverless land: explicit-and-wrong is much worse than implicit-and-right.
Aside: I did briefly try
"none"after this, hoping to skip even the symlink step. It doesn’t work for a SvelteKit + Vite stack —@sveltejs/kit’s Vite plugin importskleurvia Node-stylenode_modules/resolution, andsvelte-checkcan’t find dependency types withoutnode_modules/on disk. The build itself fails. Mention to save anyone reading this a half-day.
The init-hook trap
With the Initialize walk gone, cold-start was ~692ms. Still slow, and now the second pattern — the one I’d added in my Node-muscle-memory attempt to make things faster — was visible:
[init] isolate ready +12ms
  bootstrap admin +47ms
  warmPool +96ms
  cleanup sessions +49ms
[serve] first request +247ms
About 240ms of blocking work in init() before the server even started accepting requests. Here’s what I had:
// file: src/hooks.server.ts (before)
export async function init() {
  await Promise.all([
    warmPool(),                  // open 4 PG connections
    cleanupExpiredSessions(),    // delete expired session rows
    ensureBootstrapAdmin(),      // upsert the bootstrap admin row
  ]);
}
Sensible on Node: pre-warm the pool so the first burst of concurrent requests after sign-in each find an established socket; sweep expired sessions on boot so the table doesn’t grow unbounded; ensure the admin row exists before serving traffic. Wrong on an isolate, same reason "auto" was wrong: the four pre-warmed connections die when the isolate dies. By the time the user clicks their second thing, the isolate may already be a different one with its own cold pool, and I’ve paid 4× (TCP + TLS + Postgres auth) at boot for nothing.
So the fix to round two was deleting the fix from round one. Move each piece to where it actually belongs:
// file: src/hooks.server.ts (after)
export async function init() {
  // Norwegian holiday cache is fire-and-forget — non-blocking, fine to keep.
  void warmHolidayCache();
}

if (Deno.env.get("DENO_DEPLOYMENT_ID")) {
  Deno.cron("cleanup-expired-sessions", "0 3 * * *", async () => {
    await cleanupExpiredSessions();
  });
}warmPool()— deleted. The DB module already creates connections lazily on first query, and that’s correct: pay the cost when (and only when) you need the connection.cleanupExpiredSessions— moved toDeno.cron. Runs once a day at 03:00 UTC. Isolate boots don’t carry housekeeping that doesn’t depend on them.ensureBootstrapAdmin— moved intoscripts/migrate-deploy.ts, the pre-deploy command. Runs once per deploy, not once per cold-start.
That gut dropped cold-start from ~692ms to ~454ms. Combined with the nodeModulesDir fix, ~9× faster than where I started.
The trade-off
Honest part: the first DB-hitting request after a cold-start now pays the connection handshake inline. About 30–60ms, depending on region.
I think that’s the correct trade. The alternative is paying 4× that, eagerly, on every cold-start — including the ones that turn out to serve static assets and never touch the database. Lazy is right because isolates are cheap to throw away. Don’t pre-spend on a process you’re going to lose. Warm requests are unchanged at ~110ms.
What I’d take into the next isolate-shaped project
A few things I want to internalise so I don’t relearn them:
- Top-level scope is paid-per-request, not paid-once. Anything that can wait for the request that needs it, should.
Promise.allat module top is a smell on Deploy. Lazy initialisation isn’t a micro-optimisation — it’s the natural shape. - Housekeeping doesn’t live in an isolate’s boot. Use
Deno.cronfor periodic work, pre-deploy scripts for one-shot work. The boot path runs once per cold-start; cron runs on a schedule across isolates; pre-deploy runs once per deploy. Match the cadence of the work to the cadence of the host. - The boot phase is your observability blind spot. OTEL begins inside your handler — everything before is invisible. Until I find a better trick, the gap between
curl -w '%{time_total}'and theserver-timingheader is the cold-start measurement. If anyone has a cleaner instrumentation pattern for this, I’d love to hear it. - Audit the boot graph. What does your framework import at module top? What does that transitively import? The
Initialize <pkg>@<ver>log lines were a free signal I’d been ignoring — they map one-to-one to “things being paid for on every cold-start.” If your platform gives you that signal in some form, look at it. - Default beats explicit when the default is right. I had set
nodeModulesDir: "auto"to “be explicit” inside a refactor commit five months ago. The fix was unsetting it. Be careful what you smuggle into “tidy things up” commits, especially settings that look like ergonomics but are actually performance.
The piece I’m still unsure about is how much of this generalises. Cloudflare Workers and Vercel Edge are also V8-isolate-based; presumably the same shape applies, but I haven’t measured. Lambda is a container, so the eager-init pattern is probably less of a footgun there — though the cold-start cost moves to the container instead. The mindset shift is the portable thing: in a process you boot once, eager work amortises; in an isolate you boot constantly, eager work compounds.
The area I want to dig into next is WebAssembly. A V8 isolate is already light compared to a container, but you still pay to boot a JavaScript engine. Wasm-based platforms drop the engine entirely and execute precompiled bytecode in a sandbox — Fermyon advertise sub-millisecond to single-digit-millisecond cold starts for their Spin runtime, an order of magnitude below what I just landed. That makes everything I learned in this post still relevant (top-level work compounds, lazy is right, housekeeping has its own cadence) — but with the room for eager mistakes shrunk to where they might actually be invisible.
In the end, all it took was two config files and one server hook 🙈😅